- 67% of customers who had a great experience with an employee said they would buy again from that organisation, compared to 11% who had a bad experience.
- 63% of customers who had a great experience with an employee said they would recommend that organisation, compared to 10% who had a bad experience.
ROI Toolkit
Investing in service through improved marketing boosts conversion rates and revenue.
The methodology
The following outlines the recommended steps to implement this methodology:
- Measure current marketing conversion rates: Track click-through rates, web visits, and conversion rates to establish a baseline.
- Identify drop-off points in the sales funnel: Determine where prospective customers abandon the process, such as leaving a website without purchasing or abandoning a shopping cart.
- Add live service support: Introduce a live chat or telephone support option at key stages in the customer journey to assist with questions, remove barriers, and speed up purchasing decisions.
- Calculate the impact on conversions: Compare conversion rates before and after implementing live service support to measure additional sales revenue.
An example of how an organisation might use the Marketing Spend and Conversion Rates metric
An e-commerce business added live chat support during checkout to address customer concerns. Before implementation, the conversion rate was 2%, generating £5M in monthly revenue. After adding live chat, the conversion rate increased to 3%, resulting in an additional £2.5M in revenue. The cost of live chat agents was £600K per year, leading to a net ROI of £29.4M annually. With improved conversion rates, the company also reduced marketing spend by £500K.
Things to consider
Pinpoint areas in the sales funnel where prospective customers disengage.
Compare conversion rates before and after adding live service support.
Higher conversion rates may allow for reduced marketing spend, creating a cost-neutral way to enhance service.
Key research/insight from us
Research from post card
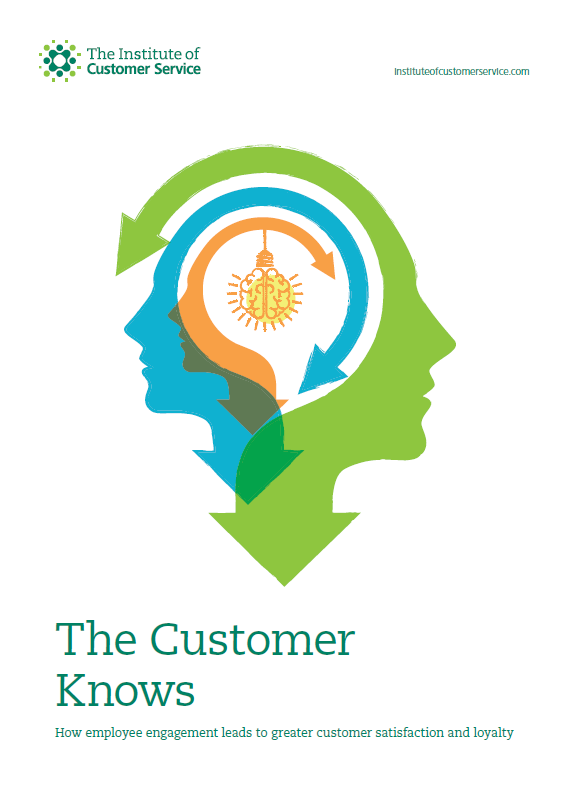
The Customer Knows (2016)
The Customer Knows (2016)
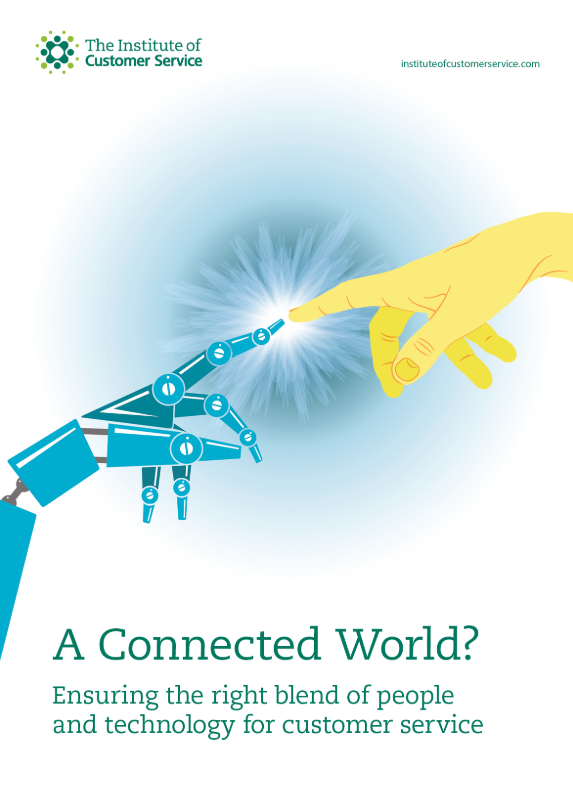
A connected world?
A connected world?
Key themes of the research include:
- Which technologies and applications will be most important for customer experience
- What is required to implement technologies successfully and achieve business performance and customer service objectives?
- How best to achieve optimum blend of human and technology-based experiences?
- What should organisations do to reduce the risk of digital exclusion ?
- From an AI, data or personalisation perspective are there technologies that are “off limits”?
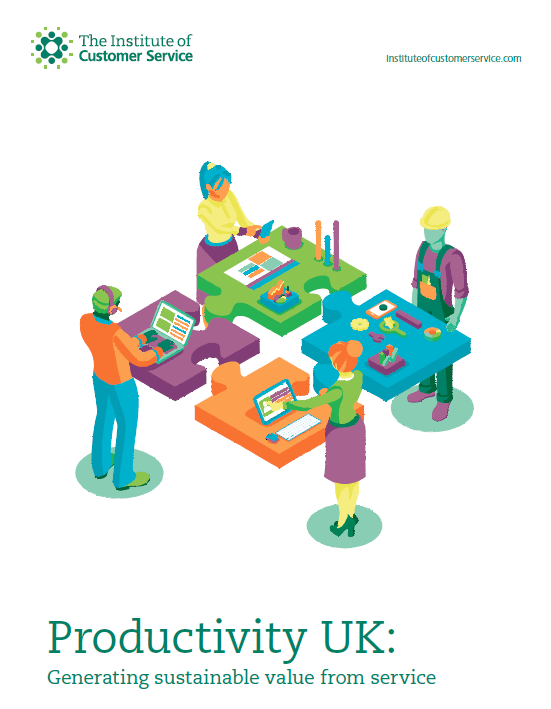
Productivity UK
Productivity UK
With almost 80% of UK GDP generated by the service sector, there is an urgent need to define, develop and measure productivity in a service context.
This Breakthrough Research examines the perspectives of senior managers, employees and customers on productivity in a service context.
The research looks at how organisations have sought to improve both their productivity and customer satisfaction, and recommends a framework to enable organisations to improve and measure their performance.